How to Get Accurate iOS Profiling Data for Applications

An important step in developing an iOS application is performance optimization. Making an app run smoothly on any device is crucial to ensure that it will offer a good user experience.
However, when faced with performance issues, it’s not always possible to understand why an application performs poorly by only looking at the code. Gathering app profiling data at runtime is often necessary to determine where and how the code needs to be optimized.
This profiling data often comes in the form of so-called counters, which tell you how many times a region of code, such as a function, was executed. These counters can then be extrapolated into large-scale statistics or correlated with other data sources to provide insights into your application’s runtime per
formance.
There are multiple ways that such counters can be obtained, but the two most common approaches are:
- Sampling does not require rebuilding your program. It is done by an external process that observes your program’s execution and, for instance, counts how many times each function has been executed.
- Instrumenting requires rebuilding your program with special flags so the compiler can add “checkpoints” throughout in your program, which will individually keep track of how many times they’ve been hit.
Getting accurate profiling data from your iOS application is crucial to optimize it correctly. Fortunately, both of these techniques will produce very accurate data, and choosing which one to use depends on what your constraints (or preferences) are.
In this article, we’ll discuss several tools that can be used to instrument or sample your application and the pros and cons of each.
Sampling with Xcode’s Instruments
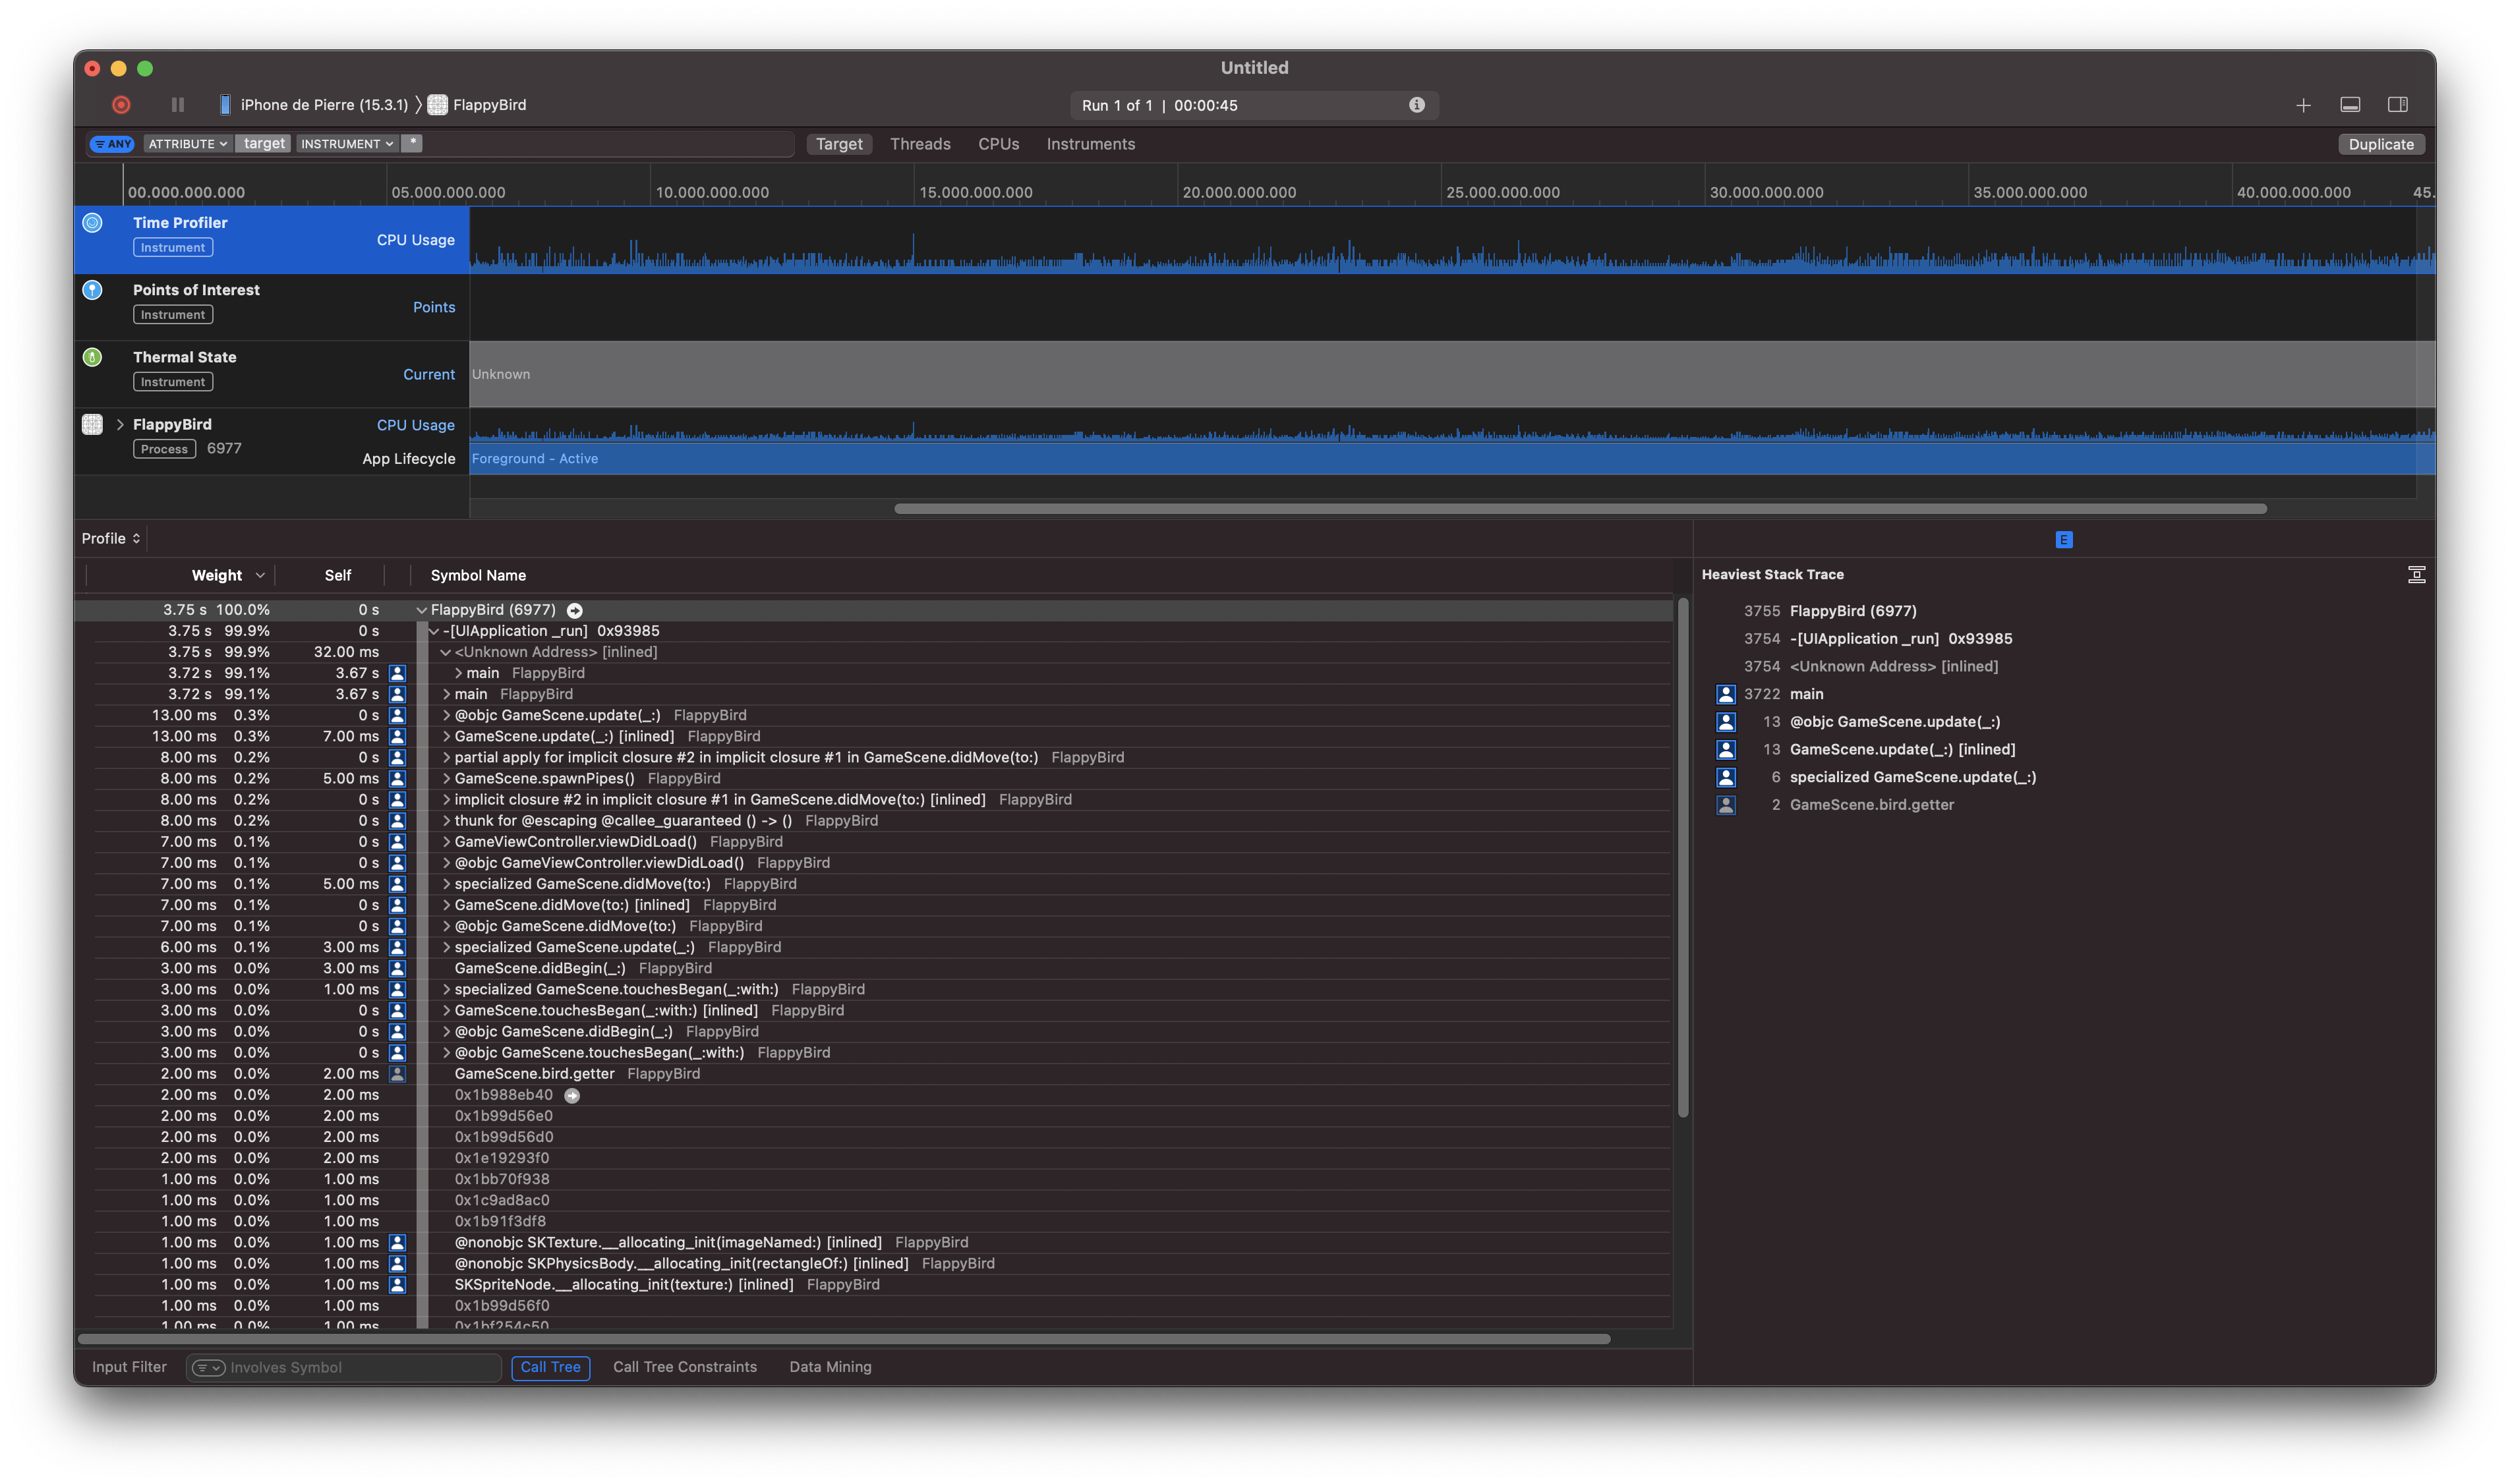
The most well-known technique for obtaining performance data in the Apple ecosystem is through the Instruments app. This can be used to sample your application at runtime so you can get an accurate performance profile without having to rebuild the application.
As explained before, sampling is done by an external observer process, which will check what your application is doing periodically (as often as every few milliseconds). Based on the current program counter of your application (i.e. the current code being executed) and your app’s debugging symbols, the tool will know exactly which function is being executed for each sample taken.

This is convenient because it requires little effort on our side and does not require rebuilding the application. It’s also very accurate if the sampling rate is high, as you will basically know what your application is doing every millisecond. However, Instruments has a couple of drawbacks:
- It’s a black box: We have little insight into how it gathers its data and how it estimates where our application is spending its time.
- It doesn’t allow exporting the data to a format that can be read by third-party tools. It only allows saving the data to trace files that do not have a fixed structure (They contain private serialized classes that can change between Xcode versions).
If the tool outputs data in an undocumented or unstable format, it can often be a deal-breaker because it becomes very difficult to manipulate the data outside of Instruments (such as scripts or third-party tools). This means that Instruments is not the best solution for continuous integration or automation purposes, even though it is perfectly viable to manually optimize your application.
Instrumenting with Xcode’s Performance-Guided Optimization
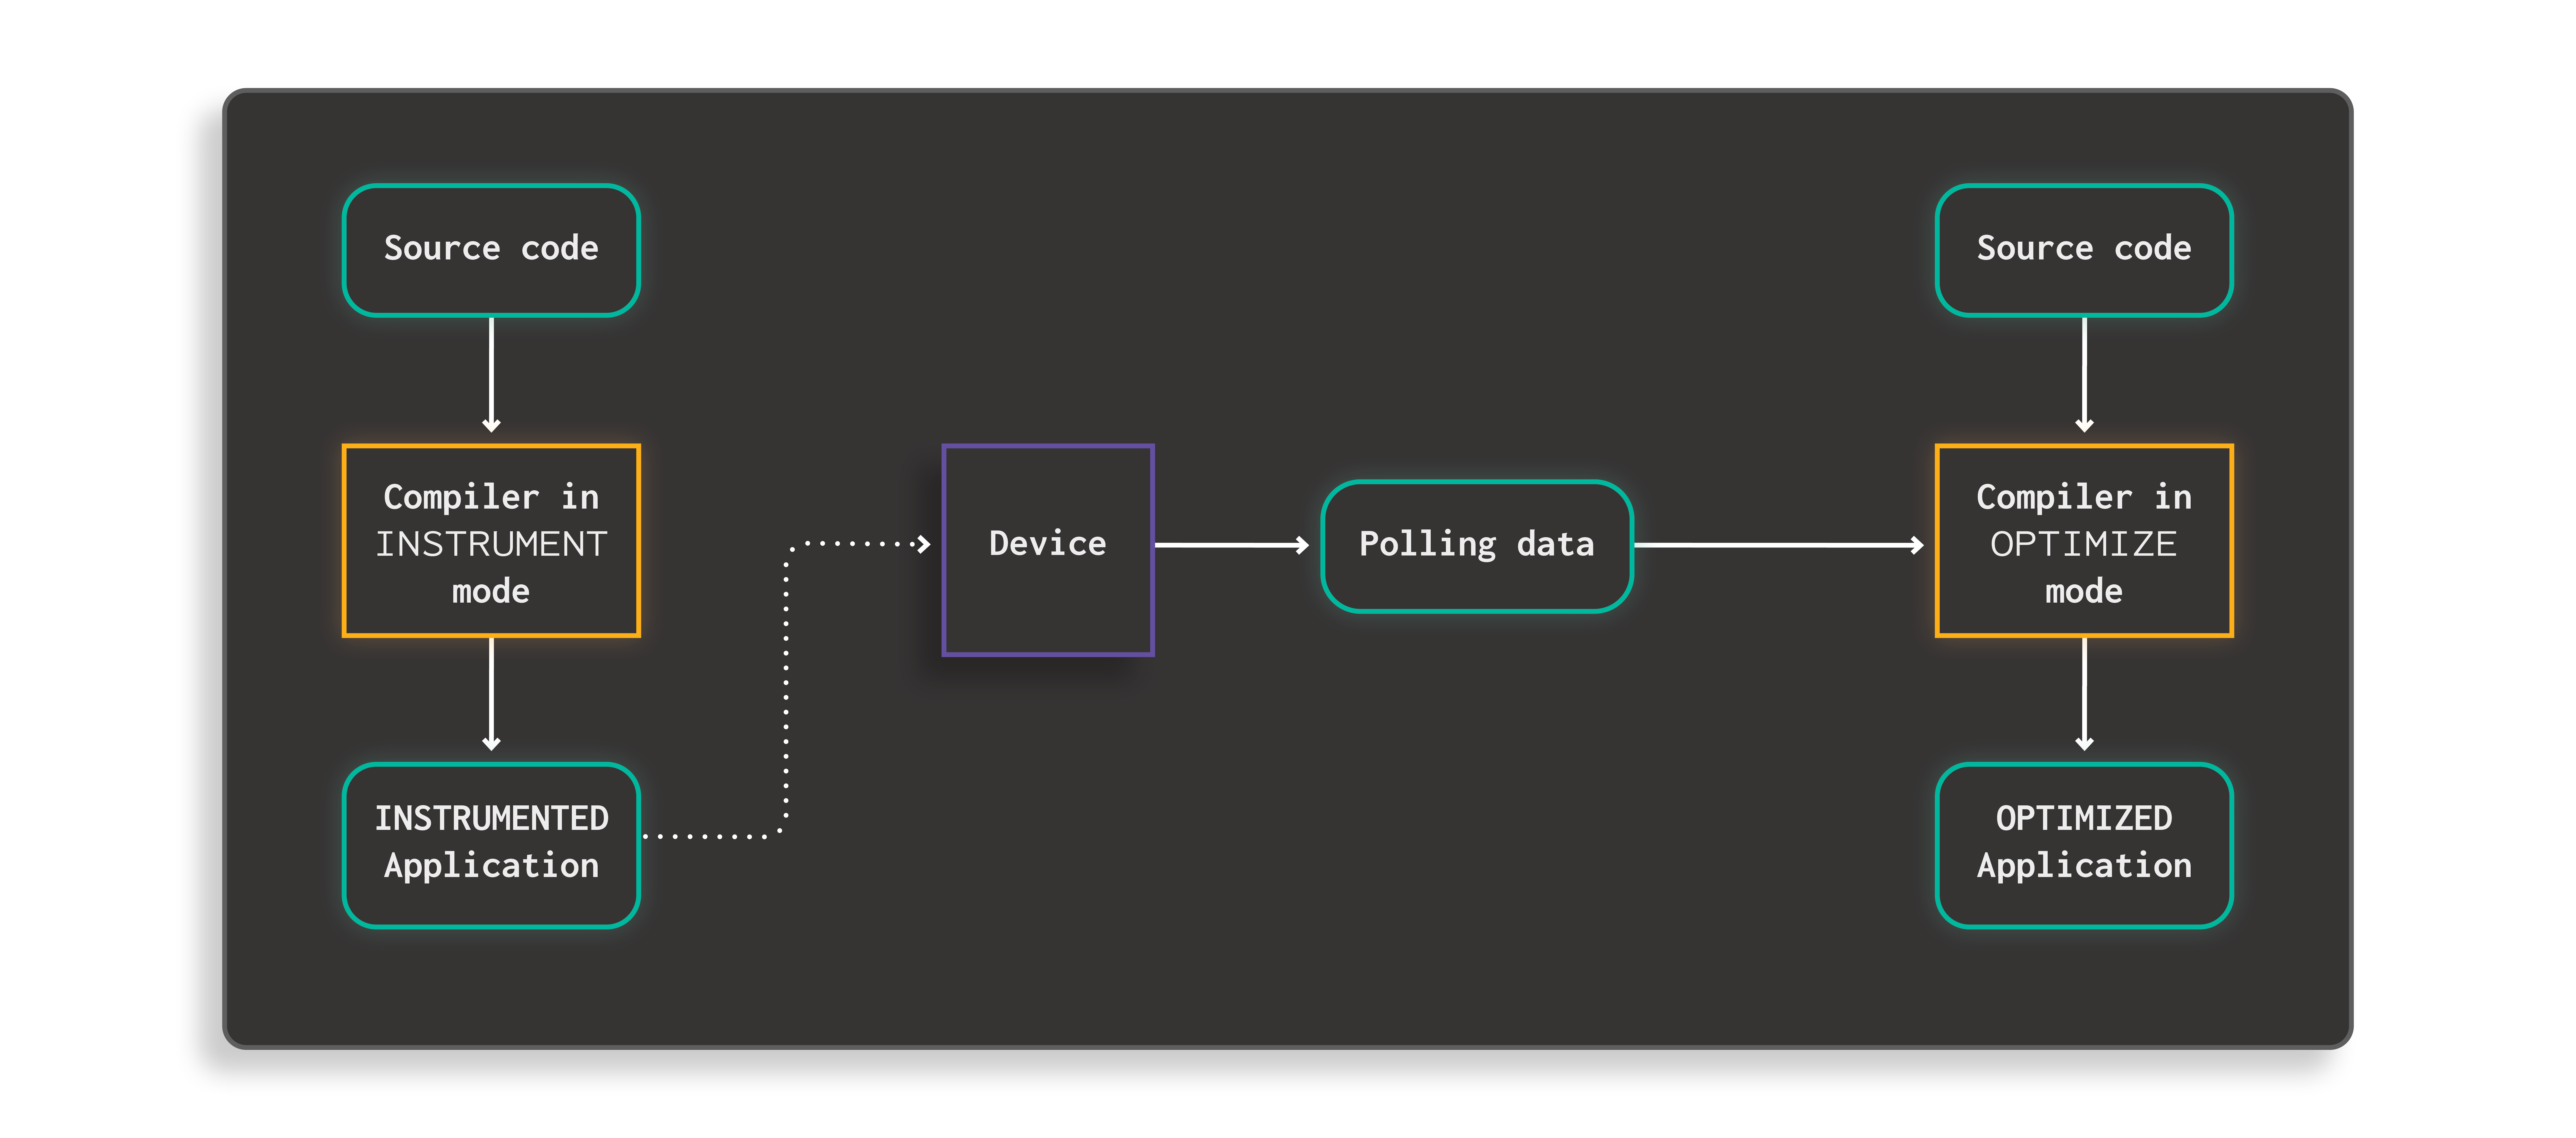
Xcode also offers an instrumentation system through its performance-guided optimization (PGO) feature for both Swift and the C family of languages (Objective-C, C++, etc.). It’s built into Xcode and allows you to generate a performance profile of your application without needing external tooling. The performance profile can then be fed back to the compiler so it can leverage this runtime information to better optimize your application.
 [Build the app once with instrumentation enabled, use it on a device to generate a performance profile. The performance profile can then be used to rebuild the application with profile-guided optimization.]
This performance profile can be visualized as a map of function names to counters, where a counter indicates how many times a given function was executed. In the case of Xcode, the data is encoded as LLVM ProfData, which is machine-readable (by using thellvm-profdatacommand, or by using the LLVM ProfilingData library in C++).
There is one issue though: The function names found in the profile aren’t guaranteed to match the symbol names in the final executable. This is because this performance profile is a front-end profile. It’s meant to be read by the compiler’s front-end and no one else, thus, it is free to name functions however it wants. This can be a blocker if you want to map the function names in the profile to symbol names in your binary or in a stack trace.
But there is also another problem with Xcode itself: It’s a black box when it comes to generating optimization profiles. It tends to keep technical details to itself and if something goes wrong, it outputs short, succinct error messages such as “Cannot generate optimization profile”. These messages do not help the user understand what went wrong, which can make generating an optimization profile a frustrating experience.
One must also be aware that this exclusively works for the code that Xcode will compile when building your application. Any pre-built dependencies will not be instrumented, and no data will be available for them. This could be a problem depending on how much your project relies on prebuilt dependencies, and what you want to do with the iOS profiling data. For instance, if you would like to use it to only optimize your application, then this downside should not be a problem: you cannot optimize prebuilt code anyway, so you do not lose value if you don’t have profiling data about it.
Even though it has issues, front-end data can still be pretty useful because the names will not always change when lowering to machine code (The names usually do not change with Clang, but they may change with the Swift compiler). This is a perfectly viable option and has the advantage of producing machine-readable data, and thus is worth considering.
Full LLVM IR-level Data, The Holy Grail?
We have just learned about front-end instrumentation profiles and some of their downsides. However, there is also another kind of instrumentation profile that we haven’t discussed yet: LLVM IR-level profiles.
These are similar to front-end profiles and share most of their weaknesses, with one exception: the symbol names they use should always match with the symbol names found in the compiled binary. They are generated by instrumenting the code at a later stage of the compilation process (in the back-end), when function names are fixed and guaranteed to not change anymore.
Unfortunately, only Clang (The compiler for the C family of languages) supports generating LLVM IR-level profiles through the-fprofile-generatecompiler flag. The Swift compiler does not offer that feature: it only has an option to enable front-end instrumentation.
Even if we take Swift out of the picture, generating LLVM IR-level profiling data and extracting it from the device can prove to be painful. The LLVM instrumentation runtime will, by default, try to write the profile to the current working directory underdefault.profraw. But the current working directory of an iOS application is the root of the filesystem; which is of course not writable unless your device is rooted. Furthermore, the application container, which is the only writable directory that an application has access to, has a unique path that is generated when installing the app. It cannot be known ahead of time.
Thus you need to use Objective-C APIs mixed with LLVM APIs to correctly initialize the output path of the app profiling data at runtime, an example of this is shown in the code snippet below. This needs to be done separately for every executable and framework of your application. If you cannot modify a dependency’s source code (e.g. standard libraries), then you cannot add this snippet to it, and will miss profiling data from that part of the code.
In short, you will be able to get very detailed and reliable iOS profiling data for your own code, but you will always miss out on some part of the picture.
extern "C"
{
  void __llvm_profile_set_filename(char*);
}

void
set_profile_data_output()
{
  NSString* outputFolder = [NSSearchPathForDirectoriesInDomains(
    NSDocumentDirectory, NSUserDomainMask, YES) lastObject];
  NSString* outputPath = [outputFolder stringByAppendingString:@"/mydata.profraw"];
  __llvm_profile_set_filename([outputPath cStringUsingEncoding:NSASCIIStringEncoding]);
}
iOS Profiling: No One Size Fits All
We’ve reviewed three options to get accurate performance data out of iOS applications, each with their own pros and cons.
The most common option, Xcode Instruments, is quite powerful and easy to use, but isn’t as easily automated or integrated into tooling. However, it’s ideal for users who wish to manually optimize their application. It also has the advantage of not requiring users to rebuild their applications, so it plays well with prebuilt dependencies as long as you have symbols for them.
Then, there is Xcode’s profile-guided optimization feature, which is great to get more performance out of your application, but produces data that is not meant to be consumed by anything other than Xcode & the underlying compiler. Thus, third-party tools may have difficulty understanding the data. This approach also requires rebuilding your application to instrument it, which can make iterating tedious and does not work for prebuilt dependencies such as system libraries.
Finally, we have LLVM IR profiles which are very similar to Xcode’s profile-guided optimization profiles and share most of their downsides. But they can be used by anyone, instead of just the compiler, and are much more suited for automation & machine-reading. Unfortunately, it’s not easy to get IR-level profiles at this time, as they’re only supported for the C family of languages and require adding extra code to your application.
Each of the options we discussed is built for a specific purpose, meaning they work well for their purpose but have limits for more general usability. None of the options combine ease of use, automation-friendliness and compatibility with other tools at the same time. In short, there is currently no “one size fits all” solution for profiling iOS applications, so you’ll have to pick the tool that most closely fits your use case.


